dq.plot.grid
grid(
    n: int,
    nrows: int = 1,
    *,
    w: float = 3.0,
    h: float | None = None,
    sharexy: bool = False,
    **kwargs
) -> tuple[Figure, Iterable[Axes]]
Returns a figure and an iterator of subplots organised in a grid.
Warning
Documentation redaction in progress.
Note
This method is a shortcut to Matplotlib
plt.subplots().
Examples
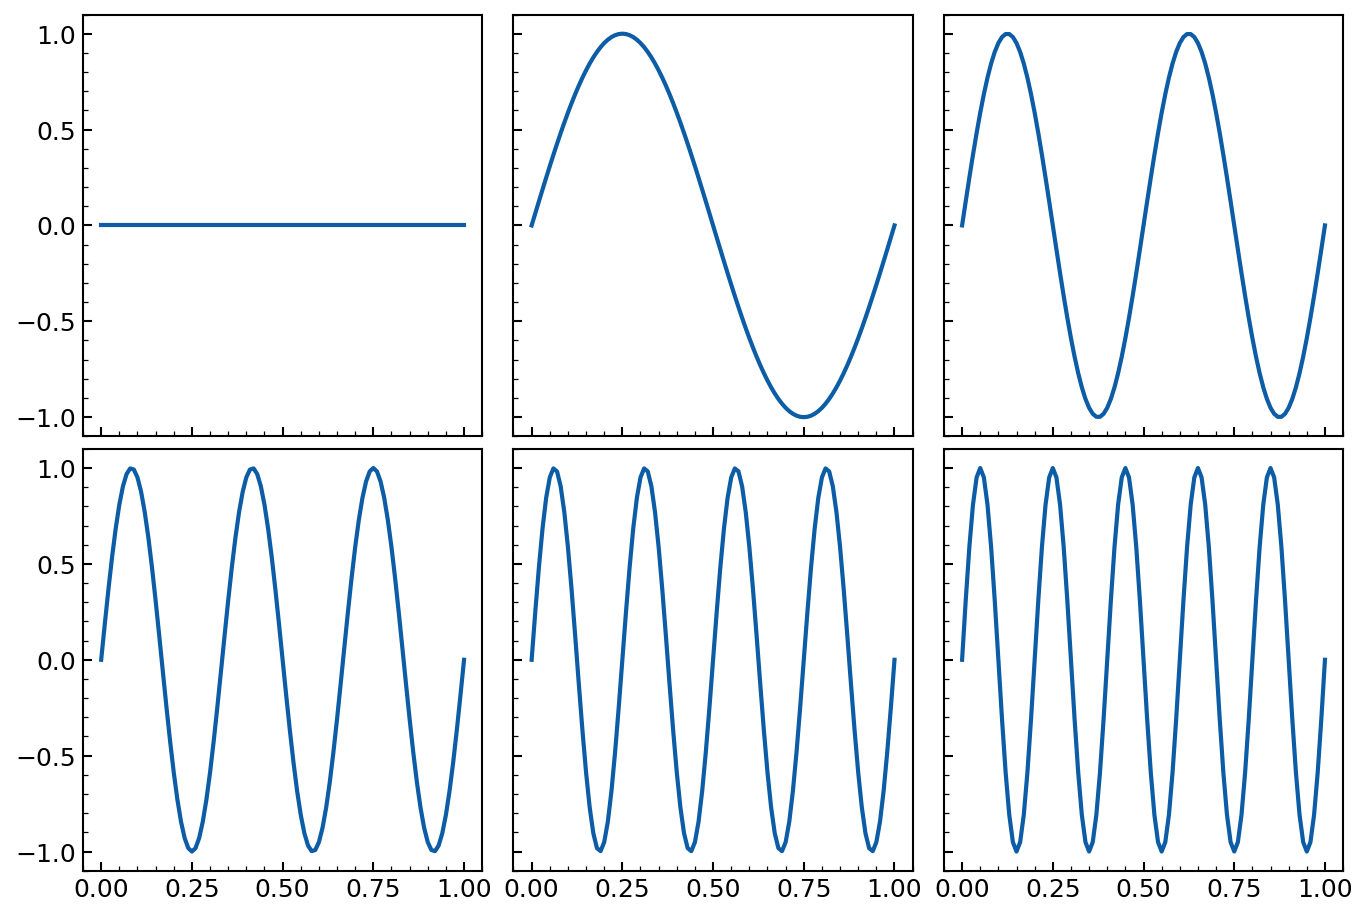
For example, to plot six different curves:
>>> x = jnp.linspace(0, 1, 101)
>>> ys = [jnp.sin(f * 2 * jnp.pi * x) for f in range(6)]  # (6, 101)
Replace the usual Matplotlib code
>>> fig, axs = plt.subplots(
...     2, 3, figsize=(3 * 3.0, 2 * 3.0), sharex=True, sharey=True
... )
>>> for i, y in enumerate(ys):
...     axs[i // 3][i % 3].plot(x, y)
>>> fig.tight_layout()
by
>>> _, axs = dq.plot.grid(6, 2, sharexy=True)  # 6 subplots, 2 rows
>>> for y in ys:
...     next(axs).plot(x, y)
