dq.plot.mplstyle
mplstyle(*, usetex: bool = False, dpi: int = 72)
Set custom Matplotlib style.
Warning
Documentation redaction in progress.
Examples
>>> x = jnp.linspace(0, 2 * jnp.pi, 101)
>>> ys = [jnp.sin(x), jnp.sin(2 * x), jnp.sin(3 * x)]
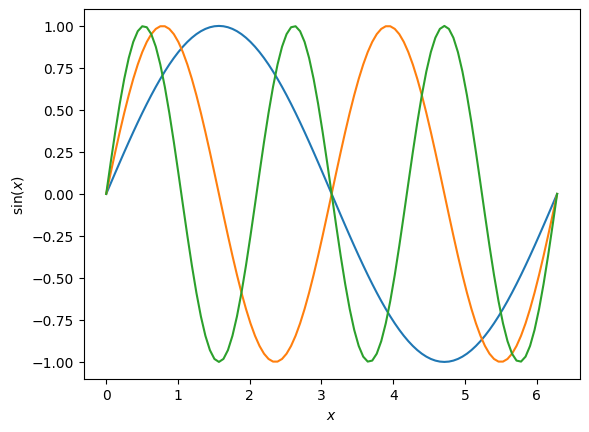
Before (default Matplotlib style):
>>> fig, ax = plt.subplots(1, 1)
>>> for y in ys:
...     ax.plot(x, y)
>>> ax.set(xlabel=r'$x$', ylabel=r'$\sin(x)$')
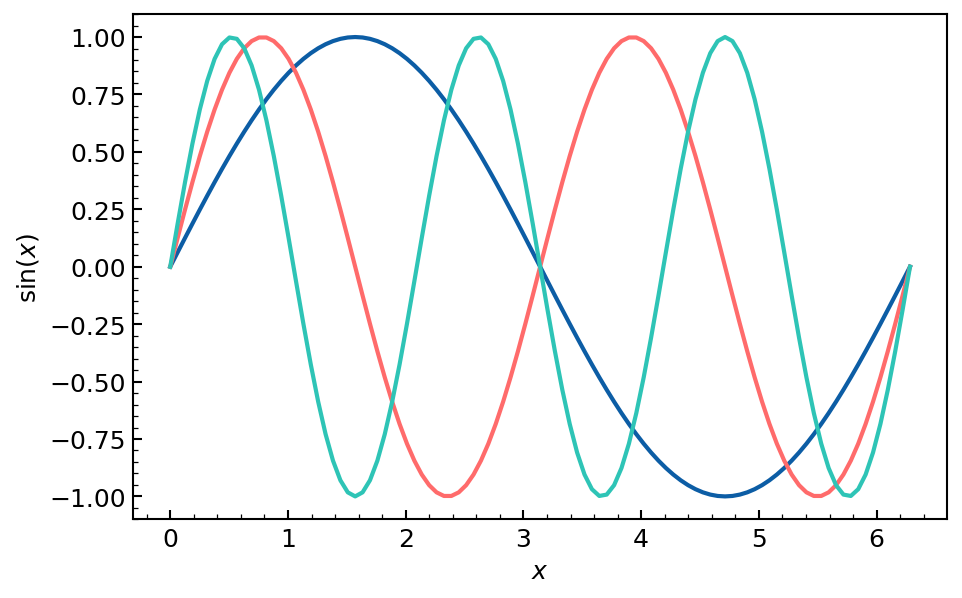
After (Dynamiqs Matplotlib style):
>>> dq.plot.mplstyle(dpi=150)
>>> fig, ax = plt.subplots(1, 1)
>>> for y in ys:
...     ax.plot(x, y)
>>> ax.set(xlabel=r'$x$', ylabel=r'$\sin(x)$')